 As much as you would love to stay informed about the topics important to your business, there is simply too much information to wade through. From following news stories to digging through research papers, who has the time to read everything and still manage to eat or sleep? To address this problem, Google has created Databoard for Research Insights, an interactive, immersive site where you can explore research in a new way. The site’s responsive design and bite-sized charts and stats make it easy not only to consume information but to share it, too, as Databoard provides a tool for compiling the interesting data you find into custom infographics. Fortunately, the site works from any device, including PCs, tablets, and smartphones, and is a great tool for finding information relevant to developing your business strategy, creating presentations, and more.
Using Databoard
The best part of Databoard is that it presents all the information on the site in a bite-sized format made for sharing. With just a few clicks you’ll be on your way to learning new things and creating the infographics you need to explain new concepts in your business. Here’s how to use Databoard:
Choose the Study That Looks Most Useful to You
From Databoard’s landing page you can explore different sets of research, called studies. Currently Databoard offers the following studies: Mobile Search Moments, The New Multi-Screen World, Mobile In-Store Research, and Our Mobile Planet. Databoard’s promo video suggests the site also offers an additional study, The Traveler’s Road to Decision, so be on the lookout.
Explore Study Topics

When you enter a study’s page, you can either explore the study by scrolling through each of its topics, or you can jump to a specific topic by clicking on it.
Find Interesting Data

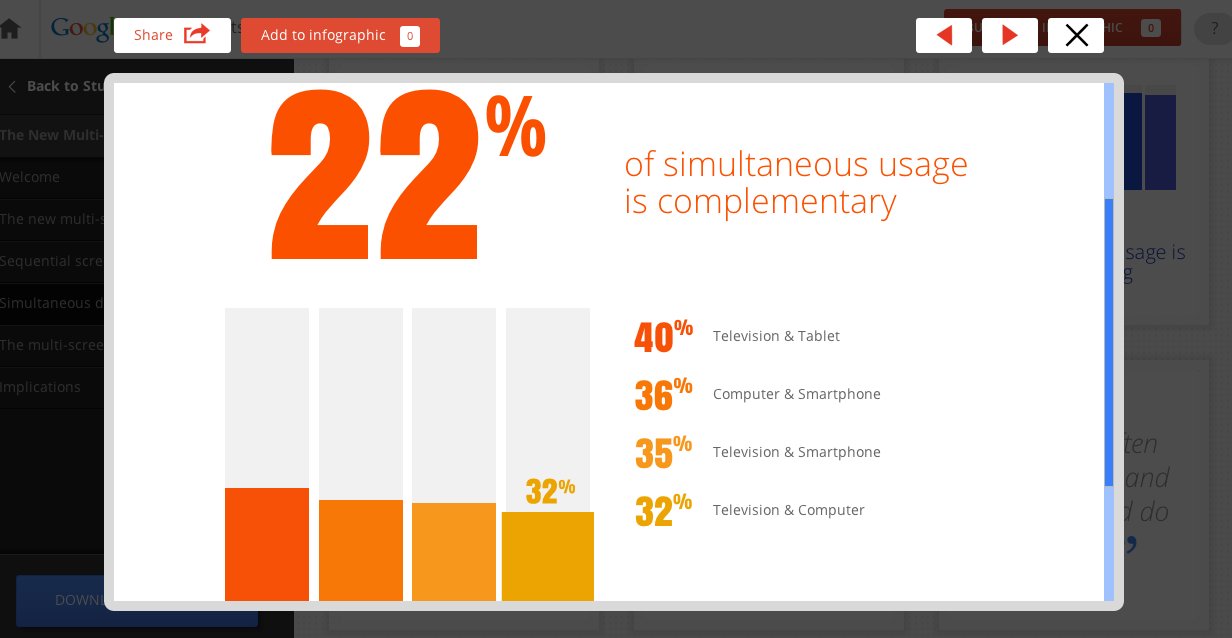
Each topic page comprises a grid of data panels that display fast stats. Clicking on a panel will provide you deeper insights into the stat, such as the chart that the stat came from. You can share individual insights to Google+, Facebook, Twitter, or email using Databoard’s built-in share button, or you can copy the insight’s URL to share elsewhere.
Create Infographics

To create a custom infographic, begin by clicking the “Add to infographic” button from an insights page. As you continue to browse, add more insights to your infographic. When you finish, you can view and rearrange your compiled insights, remove unnecessary insights, and add a title and description. When you’re ready, you can save and share your infographic, like ours here.
More to Come
Though Databoard currently focuses on Google’s market research studies for businesses, Google plans to frequently add additional studies, potentially across all research forms.
If you’re ready to jump into some interesting research, try Databoard for Research Insights, or learn more about the site by watching its promo video:
What ways can you think of to use Databoard for Research Insights?


Thanks for the info!