Do you post a lot of videos to your Facebook Page? Facebook’s new enhanced video metrics should help you determine which videos are resonating most with your audience. Soon you’ll be able to see not only how many people started watching your videos but also which parts of your videos were most engaging.
Introducing Facebook’s New Video Metrics
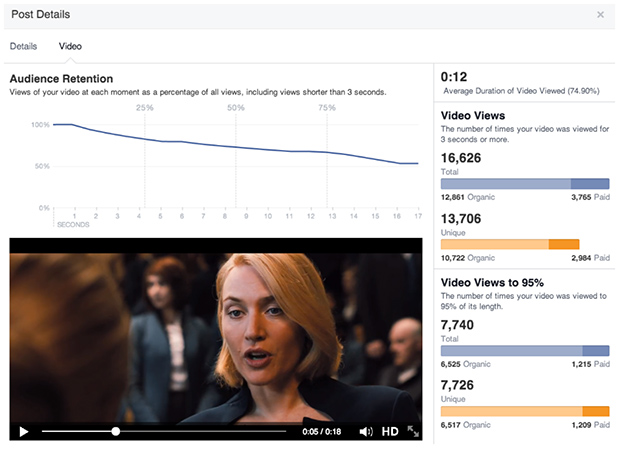
While Facebook‘s former video metrics only showed Page owners how many people started watching their videos, the new video metrics will show much more.
To start off, at the top right of your video metrics you’ll see the average amount of time people spent viewing your video and what percentage of users viewed your video for that amount of time. Next you’ll find a metric called “Video Views,” which tallies the number of times your video was played for at least three seconds, either through Facebook’s new auto-play feature or through a manual click by the user. Furthermore, Video Views is broken down into organic and paid views. The Video Views metric will also display the number of unique viewers who watched your video, similarly broken down into organic and paid viewers.
Beneath Video Views you’ll see a section titled “Video Views to 95%,” which shows the number of times your video was played almost to its end and how many unique users viewed that much of the video. Like Video Views, this metric is also broken down into organic and paid views.
A separate metric called “clicks to play video” (formerly “video plays”) will demonstrate how many times videos played through a user’s initiative rather than through Facebook’s auto-play feature.
Facebook’s New Audience Retention Graph

Perhaps one of the most interesting (and useful) features of Facebook’s new video metrics, though, is the new audience retention graph. The graph, viewable at the top left of your video metrics page, charts the drop-off times of all users who viewed your video – even those who viewed your video for fewer than three seconds. The graph makes it easy to see at which point users lost interest and stopped watching your video as well as which parts of your video were most interesting. In some cases the chart might exhibit spikes in viewership. This represents parts that were replayed by users. These parts of your video were likely the most engaging, as Facebook notes on its Business page:
The audience retention graph in Page Insights shows the level of interest in different parts of your video. Spikes in the percentage of views at a certain point may indicate that people are re-watching particular moments, whereas a dip could show the precise moment when most people lost interest and stopped watching.
Taking this feedback into account can help you determine key places to insert brand messaging.
Facebook Video Metrics for Advertisers

Facebook’s new video metrics can also add deeper analytics especially useful for advertisers. For those running targeted Facebook ads, the new “data breakdowns” feature in Ads Reporting will show you how specific audiences responded to your video. This means if you targeted a video toward teenagers, for example, the data breakdown will show you how many views your video received from that particular demographic.
The new video metrics will be available for all paid and organic videos uploaded directly to Facebook Pages and will roll out to all Pages over the coming weeks.
Learn more about how to use Facebook’s new video metrics in this PDF guide.
via InsideFacebook

